Treeline · Mountain Operations
Treeline reads your mountain's own instruments, base to summit, works out the wet bulb at every elevation, and grades every forecast against what your sensors actually recorded. One view for snowmaking, lift operations and lightning holds.
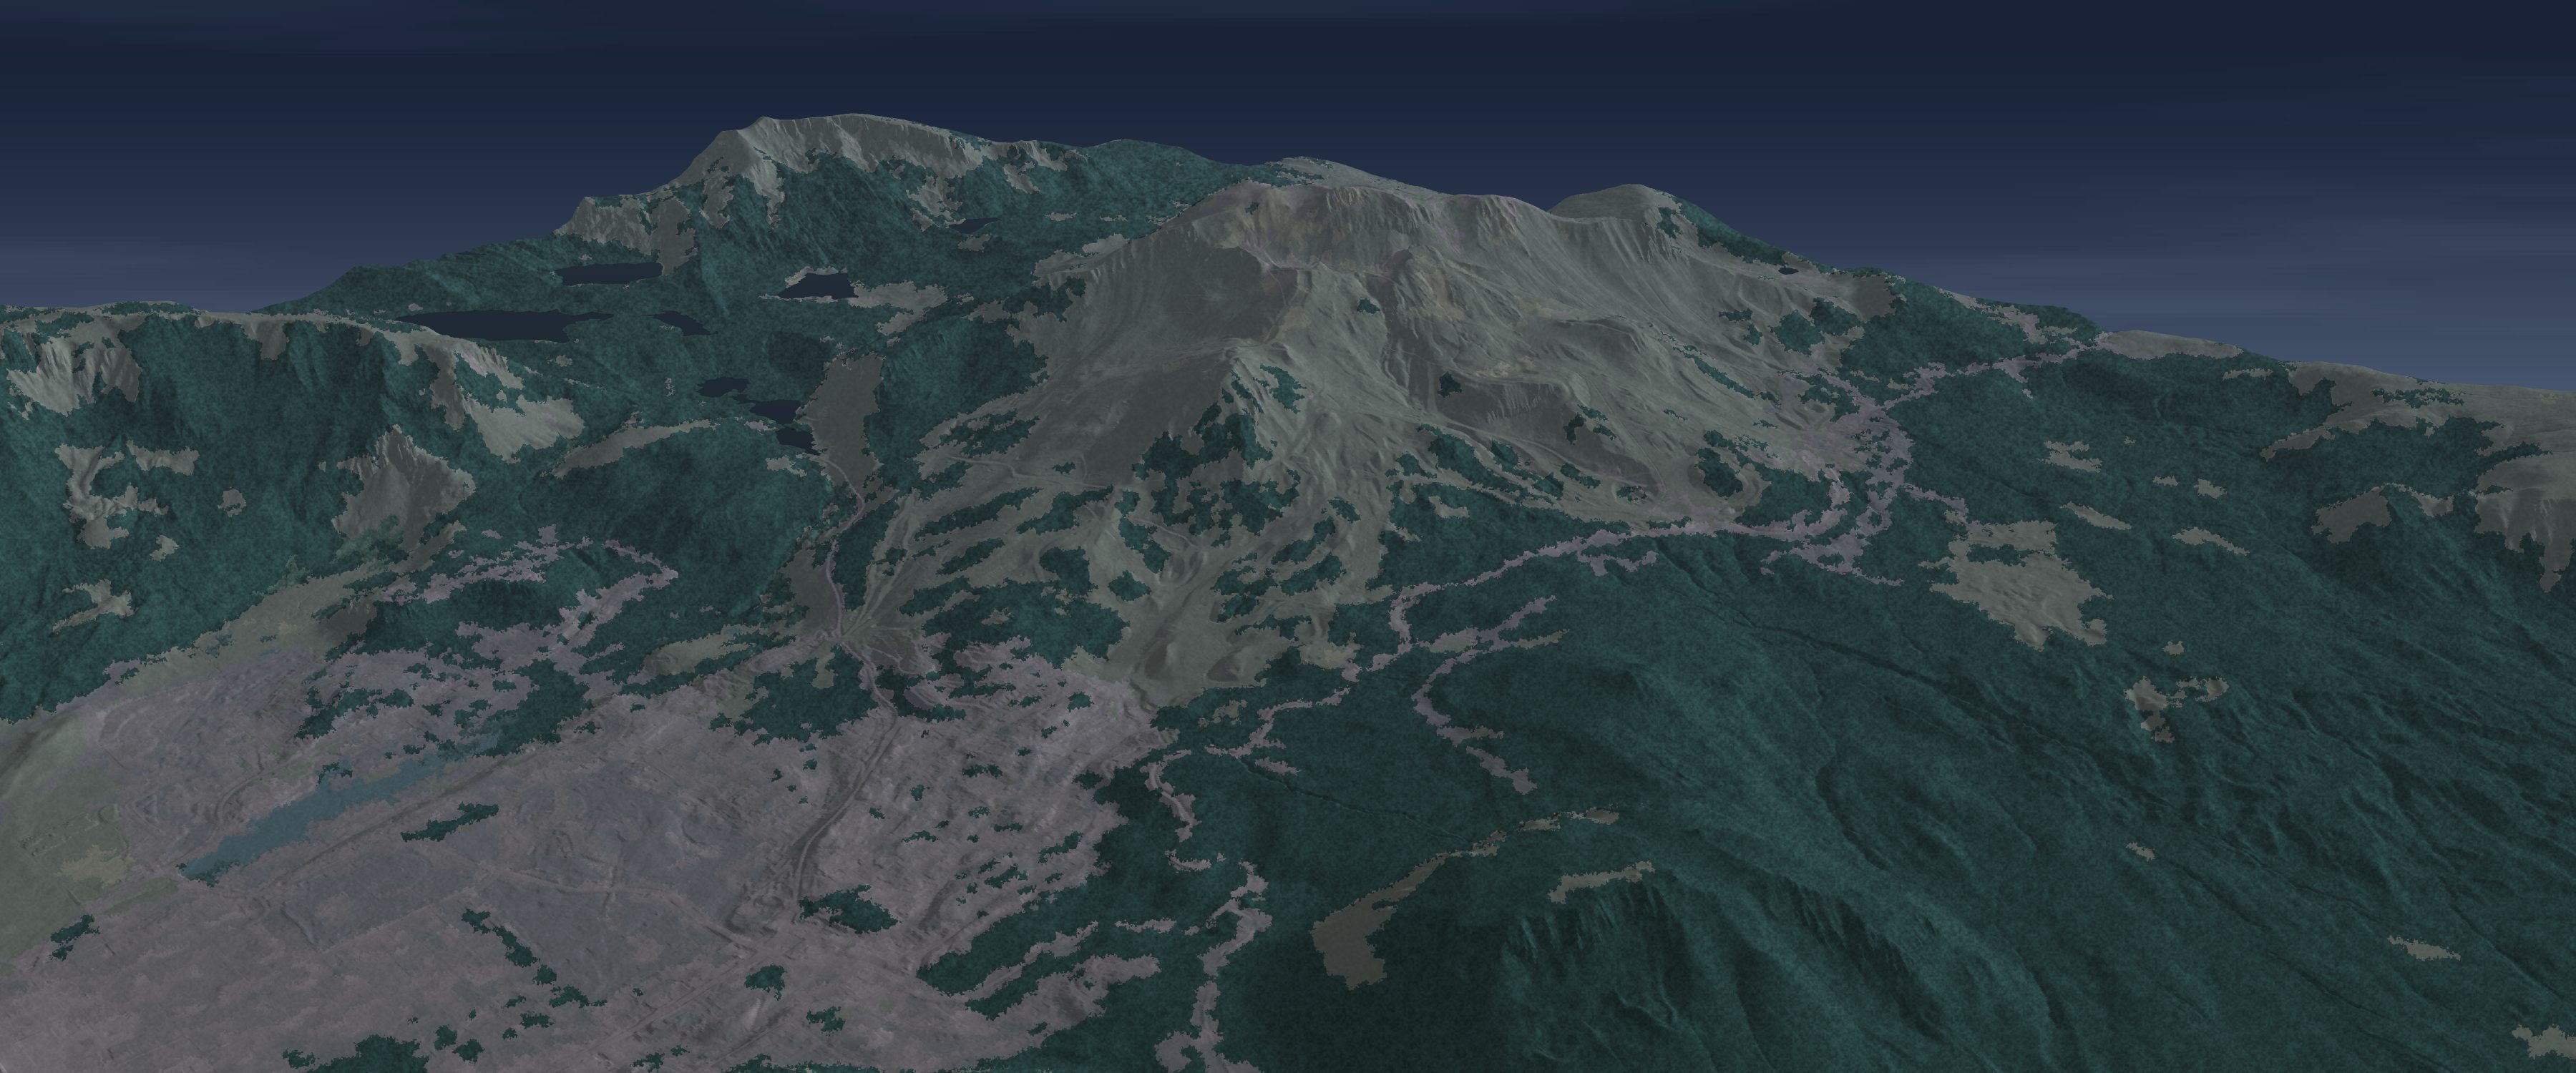
Mammoth Mountain, CA: rendered from USGS 3DEP elevation and NLCD land cover, with lifts and runs from OpenStreetMap. The sky is the cloud cover measured at the nearest airport. Re-rendered every hour.
Wet bulb, measured where the guns are
The window for making snow is set by the wet bulb: air temperature and humidity together. A single forecast for the base area misses what happens up the hill. On a clear night the cold air pools at the bottom and the summit can be warmer than the base. Your guns sit at many elevations, so the window opens and closes at different times for each of them.
Treeline takes the temperature and humidity your own sensors report, at the same moment, from base to summit. It turns them into a wet bulb at every elevation, shows the measured lapse rate, and flags inversions as they form. When the forecast and the mountain disagree, the mountain wins and the forecast gets graded on it.
Illustrative values, not a reading. On an inversion night the coldest wet bulb, and the best snowmaking, can be at the bottom of the hill while the summit sits in the marginal band.
Why a degree matters
The colder the wet bulb, the less energy each gallon of water needs to become snow. In marginal conditions a standard gun needs about six times the compressed air per gallon that it needs on a cold, dry night. Knowing when the window will actually open on your mountain, and when it will close, is what keeps those hours few and planned.
The study behind this table also found that one resort's projected energy savings came in about 30% lower than estimated, mostly because the real wet-bulb hours differed from what was expected. That is the case for measuring the wet bulb on your own hill.
| Wet bulb | Standard gun | High efficiency | Ultra-high |
|---|---|---|---|
| Below 10°F | 5 | 1.8 | 0.1 |
| 10–19°F | 7 | 2.6 | 0.1 |
| 20–23°F | 11 | 3.9 | 0.2 |
| 24–26°F | 15 | 5.9 | 0.3 |
| Above 26°F | 30 | 7.2 | 0.7 |
Air-to-water ratio by wet-bulb temperature, as given in the study. Source: ACEEE Summer Study on Energy Efficiency in Buildings, 2015, paper 2-175, Table 1.
Run your own numbers
Put in your seasonal snowmaking spend, then the share you think better wet-bulb timing could save. We don't claim a number before your season of measurement shows it. Until then this is your estimate, not ours.
Each percentage point of a $1,500,000 programme is $15,000.
Energy, labour and water all scale with run hours, so fewer wasted marginal hours save on all three. The 3% default is an assumption for illustration. Your own season of measurement replaces it with a figure from your mountain.What you get
Built on your mountain's own instruments and the Datum Grid of Truth: tens of thousands of public stations, every forecast source scored against them every day.
Every on-hill sensor at one shared moment. The view shows the measured lapse rate, flags inversions, and never mixes stale readings with fresh ones.
Calculated from your own temperature and humidity at each sensor’s own air pressure, using the WMO psychrometer formula and checked against an independent ASHRAE reference. A humidity sensor that disagrees with the rest of the mountain is named and left out, never guessed.
Speed, gusts and direction from every anemometer on the hill, each flagged against the watch and hold thresholds your lift team sets, so a hold is called on the lift that matters and not on a valley average.
Strikes within 10 and 25 miles from Vaisala’s Xweather lightning service, the 30-minute clear time after the last close strike, and a plain statement of when the network was last checked.
Every forecast we use is scored against what your instruments recorded, ours included. You see which one to trust, at which elevation and lead time, with the sample size beside every number.
Snow depth and water equivalent from the nearest public snow pillow. A broken sensor is shown as unavailable, never as zero.
Lightning, wind and storm timing for bike-park closures, and rain totals wherever your stations carry a rain gauge. The pilot can start in summer and is already working when the lifts turn for winter.
“Will the window open on the upper mountain tonight?” Datum AI answers from the same 24-hour forecast the board shows at every sensor on the hill, and says it is a forecast: when it was issued and how far it has been scored.
A forecast in your own brand for your website and app, measured against your mountain all year.
Add-on · Coming this seasonFor your guests
The instruments that run the mountain can also answer the questions guests ask at the ticket window. Treeline’s guest view answers these six from your own readings today. Putting it on your website and app, in your brand, is the Guest forecast add-on, coming this season.
After a storm, which slopes caught the new snow: Treeline reads which way the summit wind blew while the snow fell and points guests to the sheltered side. Until there is new snow it says so instead of guessing.
New snow since the lifts closed, from the nearest public snow pillow (Mammoth Pass, 9,500 ft). It counts only when the pillow’s depth and its water both rise, so a noisy sensor never reads as a powder day, and a sensor that stops reporting says so instead of showing zero.
Temperature, wind and wind chill at the top and at the base right now, from your own sensors, so guests dress for the summit and not the parking lot.
When wind is likely to slow or hold the upper lifts in the next 24 hours, from five wind forecasts at your summit sensor, each being scored against your own anemometers. Guests can plan their upper-mountain laps around it.
When each side of the mountain gets strong sun today: east faces in the morning, south faces at midday, west faces in the afternoon. Worked out from the sun’s path over each slope, so guests can follow the sun around the hill.
When cold air fills the valley and the summit is warmer, your own sensors show it, base to summit at one moment, so guests know the top is the warm place to be.
Snow guidance covers open, patrolled, in-bounds terrain only. It is not avalanche advice, and closed or out-of-bounds terrain is never rated.
Live now
This demo uses Mammoth's on-hill sensors, from Little Eagle at 8,098 ft to the Summit at 11,034 ft, including the anemometer on Gondola 2 tower 10. It refreshes every 15 minutes from NOAA's public MADIS feed. Every pin below is placed at the sensor's own coordinates on the rendered terrain.
The demo is built entirely from Mammoth Mountain's publicly available sensor data to show what Treeline does. Datum Weather is not affiliated with Mammoth Mountain Ski Area, and Mammoth has had no involvement in producing this demo.
How a pilot works
Priced per mountain, never per seat, so your whole operations team can use it.
We bring your weather stations into the Grid of Truth. If they already publish to MADIS or MesoWest, this takes days. Private systems are a scoped project.
Every forecast, ours included, is graded every day against your own instruments, at each elevation. The model that leads changes through a season, so nothing is crowned in hindsight: you watch the standings move, and our own forecast is held to the same scoreboard.
Keep the view, the wet bulb by elevation, the holds and the scorecard on an annual licence. Start in summer and you go into winter with real history already built up at your location.
“See your whole mountain as one thermal picture.”
Your own sensors become one picture of the hill, base to summit: where cold air pools, where the wet bulb sits against your snowmaking line, and which sensors are inside it right now. Beside it, every forecast is graded against what your instruments actually recorded, and the Datum blend leans toward whichever is proving right on your slopes. Your crew plans from the clearest view of the mountain they have had.
Sources: SAM, “U.S. skier visits drop 14% in 2025-26” (NSAA preliminary data) · ACEEE 2015 Summer Study, paper 2-175 · WMO-No. 8, Guide to Instruments and Methods of Observation, psychrometer formula · ASHRAE Handbook, Fundamentals (2017), ch. 1, psychrometrics.
Tell us about your stations and your season. We will show you your mountain in Treeline.